Used Car Statistics 2026, Car Complaints Rank First for the Tenth Year
Every fact, figure and legal citation in this article was checked against its original source before publication. Editorial Standards
For the tenth year in a row, cars were the top consumer complaint category in the United States, by the count of the agencies that handle the complaints. In 2025, 659,880 vehicles were reported stolen, and 997 safety recalls covered 31 million vehicles and equipment items. Those are the headline figures of this page, the first edition of our yearly used car statistics: the numbers on used car fraud and buyer risk that government agencies and the insurance industry’s crime bureau publish, each with its date and its source, and a plain account of the numbers nobody publishes at all.
First edition, published October 2026, and the first page of our Statistics section. The figures are the latest each source had published on 17 October 2026, and they will not be changed in this edition. The next edition follows in October 2027.
Key findings
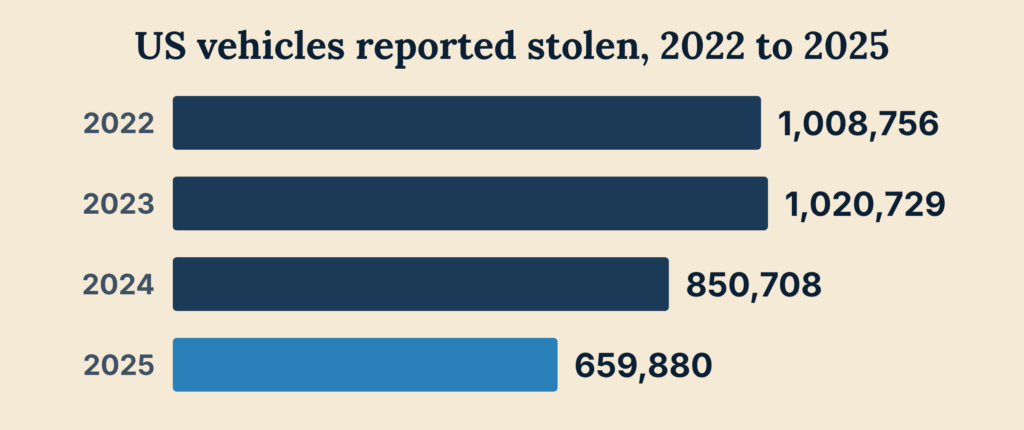
- 659,880 vehicles were reported stolen in the United States in 2025, which the National Insurance Crime Bureau calls a 23% decrease from 2024. The FBI puts the 2025 theft rate at the lowest in 20 years.
- For the tenth year in a row, auto-related issues ranked as the nation’s top consumer complaint category in the Consumer Federation of America’s survey of state and local consumer agencies.
- In Illinois, complaints about used car sales topped the Attorney General’s list for the first time in over 35 years. In New York, automobile complaints rose from 3,761 to 4,521.
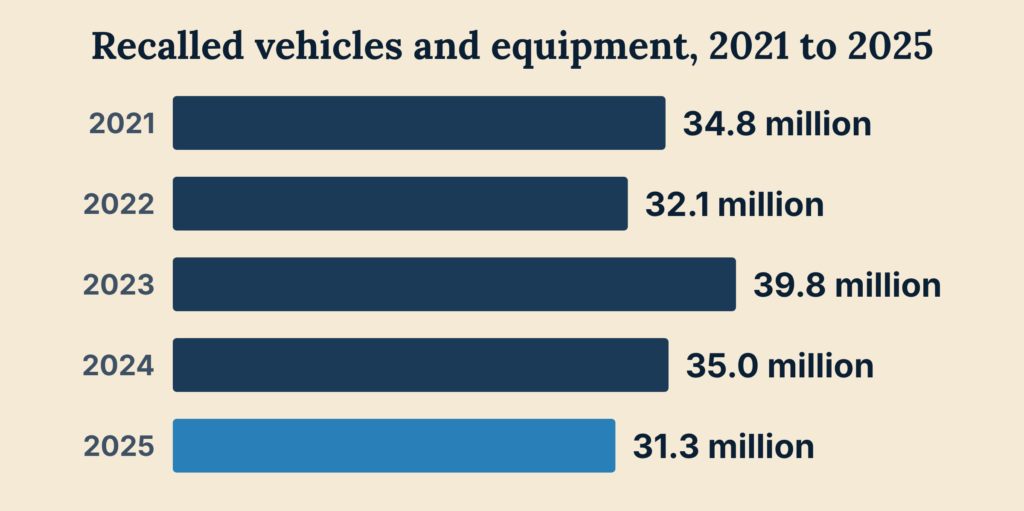
- 997 recalls covered 31,268,058 vehicles and equipment items in 2025, and 891 of them were vehicle recalls. The average completion rate of the recalls issued in 2024 was 73.4% when NHTSA last measured.
- California (136,988), Texas (75,269) and Illinois (28,327) had the most thefts. The Hyundai Elantra was the most stolen model, with 21,732 thefts.
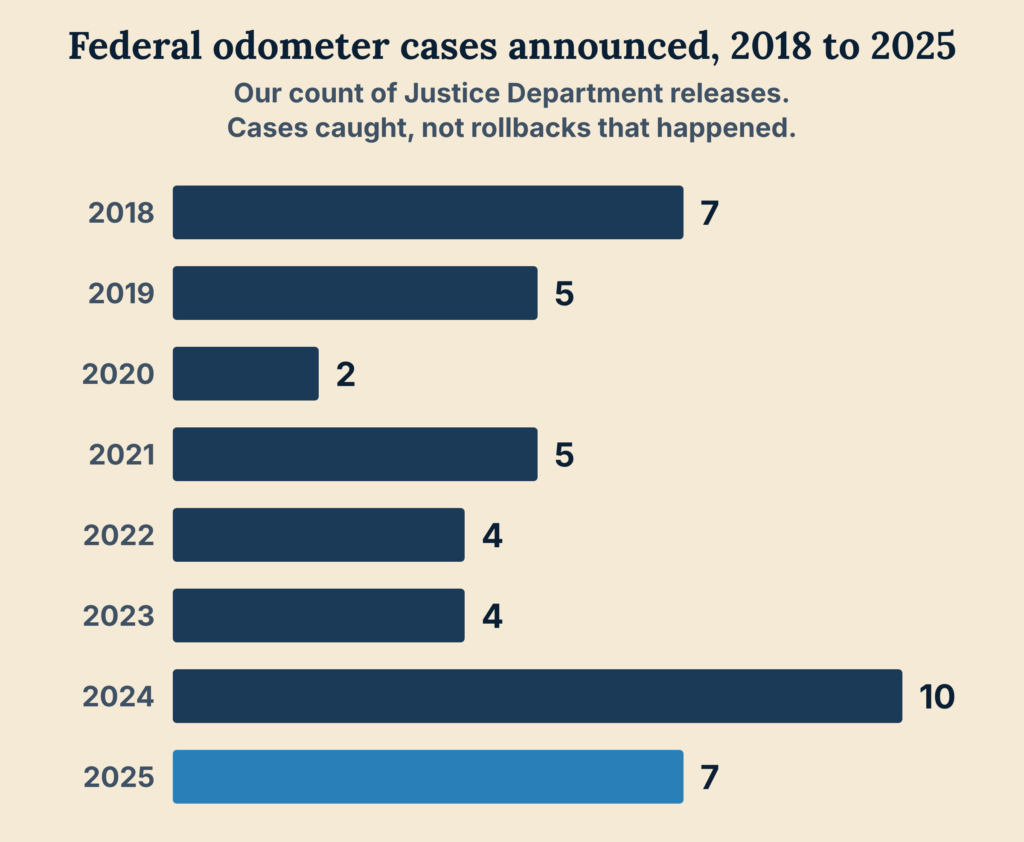
- Federal prosecutors announced charges, pleas or sentences in odometer fraud cases 7 times in 2025 and 10 times in 2024, by our count of Justice Department press releases. That is how many cases were caught and publicized, not how many rollbacks happened.
- Nobody official counts rollbacks, flood cars or washed titles. The government’s only estimate of odometer fraud dates from 2002.
Car theft fell 23% in 2025 to 659,880 vehicles
A stolen car is a used car problem as much as a crime problem, because some stolen cars come back to market with cloned identities and forged titles, and the buyer loses the car when it is found. In 2025, 659,880 vehicles were reported stolen nationwide, according to the National Insurance Crime Bureau’s release of 18 March 2026. The bureau, an insurer-funded nonprofit that compiles theft reports made to law enforcement, calls that a 23% decrease from 2024, when it counted 850,708. The 2023 count, 1,020,729, was the recent peak.
The FBI’s own summary, built on a different base, agrees on the direction. Its Summary of Reported Crimes in the Nation for 2025, released in August 2026, says motor vehicle theft decreased an estimated 22.7%, that the 2025 theft rate of 197 per 100,000 inhabitants was the lowest in the last 20 years, and that 2023 had the highest rate since 2007. The FBI publishes the rate and the change in a readable report. The count behind them sits in its Crime Data Explorer, so the count on this page is NICB’s.
The decline continued into 2026. NICB’s half-year release of 30 September 2026 counted 268,415 thefts in the first six months, 21% fewer than in the same months of 2025. None of this means a buyer can relax. A car stolen in one of the years below can be on a lot today with another car’s VIN, and the free checks in the last section are how a buyer finds out.
Car theft statistics by state, 2025
The ten states with the most reported thefts in 2025, from NICB’s state table. The three states with a guide on this site are linked.
| Rank | State | Vehicles reported stolen in 2025 |
|---|---|---|
| 1 | California | 136,988 |
| 2 | Texas | 75,269 |
| 3 | Illinois | 28,327 |
| 4 | Florida | 27,142 |
| 5 | New York | 24,206 |
| 6 | Ohio | 20,628 |
| 7 | Pennsylvania | 20,568 |
| 8 | North Carolina | 20,395 |
| 9 | Washington | 18,039 |
| 10 | Missouri | 17,496 |
Los Angeles was the metropolitan area with the most thefts (53,911), ahead of New York (27,138), Chicago (24,299), Houston (23,659) and San Francisco (22,197). The most stolen models were the Hyundai Elantra (21,732), the Honda Accord (17,797), the Hyundai Sonata (17,687), the Chevrolet Silverado 1500 (16,764) and the Honda Civic (12,725). A model on that list is not a model to avoid. It is a model whose used examples deserve a careful look at the VIN plates and the title before any money moves.
Car complaints rank first in state after state
Each year the Consumer Federation of America asks state, county and city consumer agencies which complaints they handled most. In its Consumer Agency Survey Report 2025, published 18 June 2026, the answer was the same as in the nine reports before it: “For the tenth year in a row, auto-related issues are the top consumer complaint category.” The category covers vehicle sales, leasing, repair, manufacturing issues, towing and auto insurance. The two dozen or so agencies that answered (the report gives 23 in one place and 25 in another) handled more than 310,000 complaints between them.
The state attorneys general tell the same story one state at a time, in the complaint rankings that about fifteen of them publish, most during National Consumer Protection Week in early March. In Illinois, where the Attorney General’s office took 19,763 written complaints in 2025, used auto sales were the top category with 2,103, and the office wrote: “For the first time in over 35 years, complaints about used motor vehicle sales top the list.” A year earlier the category had been fourth, with 1,607. Repairs outside a warranty (717) and new car sales (624) made the same list, so three of Illinois’s ten categories were about cars.
The table gives every state we found that published a yearly ranking or a yearly count for car complaints, with its 2025 figures where they were out by 17 October 2026. Where a state ranks cars first but gives no count, the count column says so. Virginia’s 2025 list, with automotive sales first again, was reported by local television, but we found no release on the Attorney General’s site, so the table carries Virginia’s 2024 release and says so.
| State | Where car complaints rank | Count in 2025 | Source |
|---|---|---|---|
| Illinois | 1st, used auto sales (also 8th, repair, and 9th, new car sales) | 2,103 | Attorney General, 2 March 2026 |
| Ohio | 1st, motor vehicles | not published (29,595 complaints in all) | Attorney General, 2025 annual report |
| Michigan | 1st, motor vehicle and automobile | not published (over 12,000 in all) | Attorney General, 3 March 2026 |
| Iowa | 1st, used auto and vehicle repair | 783 | Attorney General, 19 February 2026 |
| Vermont | 1st, motorized vehicles | 286 | Attorney General, chart of 2 March 2026 |
| Arizona | 1st, motor vehicle sales, repairs and rentals | not published (nearly 21,000 in all) | Attorney General, 2 March 2026 |
| Missouri | 2nd, automotive | more than 2,400 | Attorney General, 2 March 2026 |
| Oregon | 2nd, auto | 1,204 | Department of Justice, 15 April 2026 |
| New York | 3rd, automobile | 4,521 | Attorney General, 2 March 2026 |
| Tennessee | 4th, repairs and warranties (also 7th, used sales, and 10th, lease, towing and rental) | 617 | Attorney General, 3 March 2026 |
| Colorado | 5th, automobile sales and services | 1,126 | Attorney General, 2 March 2026 |
| Wisconsin | 7th, motor vehicle repair (also 8th, motor vehicle sales) | 445 | DATCP, 5 February 2026 |
| Massachusetts | not ranked, used car sales rose from 927 to 1,009 | 1,009 | Attorney General, 2 March 2026 |
| Virginia (2024 data) | 1st, automotive sales (also 7th, service and repair) | not published (6,836 in all) | Attorney General, 3 March 2025 |
The table has holes, and they are not ours. California, Texas, Florida, Pennsylvania and Georgia, five of the country’s largest states, publish no yearly complaint ranking with a car category that we could find, so the national picture is assembled from the states that do. The rankings are also counts of complaints filed, not of frauds committed: a state with an easy online form will show more complaints than a state without one. What the table shows is where cars stand in the pile of things people complain about, and in state after state the answer is at or near the top. The way to complain in a given state is in the state guides.
Recalls covered 31 million vehicles in 2025
A recall is not fraud, but an open recall is one of the things a used car buyer can inherit without knowing it. NHTSA’s 2025 Annual Report on safety recalls, published in March 2026, counts 997 recalls in 2025 affecting 31,268,058 vehicles and equipment items. Vehicle recalls alone came to 891, covering 29,262,623 vehicles. The rest were tires, child seats and equipment.
| Year | Recalls | Vehicles and equipment items affected |
|---|---|---|
| 2021 | 1,093 | 34,804,234 |
| 2022 | 1,050 | 32,141,648 |
| 2023 | 1,000 | 39,783,191 |
| 2024 | 1,073 | 35,019,977 |
| 2025 | 997 | 31,268,058 |
The number that matters to a used car buyer is how many of those cars were fixed. The same report gives the average vehicle recall completion rate by the year of the recall: the average, across all vehicle types, of each recall’s share of vehicles repaired, counted once the recall has at least five quarters of completion reporting or has reached 100% sooner. For recalls issued in 2024 the average was 73.4%, up from 67.0% for 2023 and 72.7% for 2022. The low point of the last decade was 61.5%, for recalls issued in 2021.
Put the other way, the average 2024 recall still had about a quarter of its vehicles unrepaired when NHTSA measured, and some of those are for sale. NHTSA also reports that nearly 80% of vehicle recalls have a final remedy available within 60 days, so an old open recall usually has a fix waiting at a dealer.
Any VIN can be checked for open recalls in a minute, and our free check does it against NHTSA’s own database: check any VIN for open recalls before the test drive, not after the sale. What the free check does and does not show is in our guide to what a free VIN check shows.
Odometer fraud, the cases prosecutors caught
Nobody counts how many odometers are rolled back in a year. What can be counted is how often federal prosecutors catch someone and say so. We counted the Justice Department’s press releases with the word odometer in the title, read on 17 October 2026, and where two offices published the same announcement on the same day we counted it once. By that count, prosecutors announced charges, pleas, convictions or sentences in odometer fraud cases 7 times in 2025, 10 times in 2024, 4 times in each of 2023 and 2022, 5 times in 2021, twice in 2020, 5 times in 2019 and 7 times in 2018.
Two cautions go with the count. One case can appear more than once across the years, as a charge, then a plea, then a sentence, and a case whose release does not say odometer in its title is missed. The count is a floor, and it measures enforcement, not the crime: these are the cases that were caught and announced, not the rollbacks that happened.
The 2025 cases show what a rollback operation looks like. In Ohio, the former owner of a Whitehall dealership pleaded guilty in August 2025 to altering odometers on at least 300 vehicles sold between January 2021 and January 2023, removing at least 31 million miles between them. His sentence was still to be set when the release went out. In Maryland, two brothers who bought high-mileage cars at auction, lowered the readings by an average of 124,000 miles and resold them were sentenced in September 2025 to 36 and 18 months in prison and about $1.2 million in restitution.
In Nebraska, four men were sentenced in May 2025 to between 30 and 38 months for rewinding the odometers of at least 23 cars bought in Nebraska and nearby states. The court put the loss at $104,400.
In Washington state, a man who fitted odometers from wrecking yards that showed far fewer miles and misstated mileage by as much as 100,000 miles was convicted by a federal jury on five counts in October 2025 and sentenced to 15 months in March 2026. Each count of federal odometer tampering carries up to three years in prison.
The pattern across the cases is the one our odometer fraud pillar describes: high-mileage cars bought cheaply, readings cut by tens of thousands of miles, titles rewritten to match, and sales through auctions or small lots where nobody compares the reading with the car’s service history. The five physical signs of a rollback are still the buyer’s first defense, because the paperwork in these cases was made to agree with the dashboard.
What nobody counts
The most quoted number in used car fraud is also the oldest. NHTSA’s odometer fraud page says the agency estimates that more than 450,000 vehicles are sold each year with false odometer readings, and its facts panel gives 452,000 cases a year, a 3.47% chance of a rollback in a vehicle’s first 11 years, and a cost to consumers that the page prints as $1.06M. Every one of those figures links to the same document, the agency’s Preliminary Report on the incidence rate of odometer fraud of April 2002, which put the yearly cost at $1,056 million and suggested running another sample “in about 2003 or so”. No second sample was ever published.
The page’s enforcement results, more than 250 criminal convictions in more than 30 states, fines of more than $2.8 million and restitution of more than $15 million, carry no dates and no period, so they cannot be compared from one year to the next.
Flood cars are counted one storm at a time, and only by the insurers. NICB’s figures are claim counts: more than 422,000 insured vehicles damaged by Hurricane Harvey and more than 215,000 claims after Irma in Florida, in its release of 19 October 2017, and 471,581 claims of all kinds after Hurricane Ian, 151,892 of them for personal vehicles, in its release of 24 October 2022.
For Helene and Milton in 2024, and for any storm of 2025 or 2026, NICB published no vehicle count at all. The yearly national estimates of flood cars on the road that circulate in the press come from a vehicle history company, and this page uses no company’s estimate. How many of the Harvey and Ian cars were dried out, retitled and resold is a question with no official answer, which is why we will keep writing about how flood-damaged cars enter the used car supply chain.
Washed titles have no national count either. The federal title system, NMVTIS, publishes what some states report about brands that went missing between one state’s title and the next, but no national total, and its latest report covers the year to September 2024, so it waits for next year’s edition under our rule on the age of figures. The state of the problem is laid out in our title washing pillar.
VIN cloning, the resale of stolen cars under another car’s identity, has no published count from NHTSA, NMVTIS or NICB, and neither does curbstoning, the unlicensed dealing that sells cars from street corners and parking lots. We will come back to how criminals clone VINs to hide stolen cars with the cases rather than the figures, because the figures do not exist.
Two series we expected to use fell outside this edition. The Federal Trade Commission’s Consumer Sentinel Network Data Book, which counts “auto related” complaints nationally and gives each state’s share, had not been published for 2025 when this page was written, and its latest edition covers 2024. The NMVTIS annual report is a year behind for the same reason. Both return in the next edition if they qualify.
What a buyer can do with these numbers
None of these used car statistics tells a buyer whether the car in front of them is clean. They tell a buyer what to check, and in which order. First, the stolen and salvage check: NICB’s VINCheck is free, allows five lookups a day from one connection, and reports a VIN that participating insurers have recorded as stolen and not recovered, or as a salvage or flood vehicle. Second, the build and recall check: our free VIN check decodes the VIN against NHTSA’s database and lists open recalls, owner complaints and crash ratings for the model.
Third, the paid report: a vehicle history report from a provider on the Justice Department’s NMVTIS list shows the title’s brands and the last odometer reading in the title record, which is where a rewritten title or a mileage that went backwards shows up.
Before the checks, the questions. Our fraud prevention playbook walks through a purchase from the listing to the title transfer, and the questions to ask before buying are the ones that make a seller with something to hide end the conversation. After a bad sale, the complaint channels differ by state: the attorney general in most, a consumer affairs department in a few, and the federal ReportFraud.ftc.gov for the record. The state guides name the right office for each state that has one, with the statute behind the remedy.
Cite as: VINvestigators Editorial Team (2026). Used Car Statistics 2026. VINvestigators. https://vinvestigators.com/used-car-statistics-2026/
Methodology
Every figure in these used car statistics comes from a government agency, from the National Insurance Crime Bureau or from the Consumer Federation of America, was read at the address linked beside it on 17 October 2026, and carries the date of the release it comes from. No estimate published by a vehicle history company is used or named.
Every series on this page has a 2025 value, and earlier years appear only as the earlier points of those series: the theft counts since 2022, the recall counts and completion rates since 2021, the 2024 complaint counts given for comparison, and Virginia’s 2024 ranking, marked as such in the table. A source whose latest release covers an earlier year is left out until it catches up. Two things on the page are older and are presented as such, not as current figures: the 2002 NHTSA study, because the absence of anything newer is itself a finding, and the storm claim counts of 2017 and 2022, because they show what the only flood figures look like.
The sources, in the order they appear. Vehicle theft: NICB’s release of 18 March 2026 (the 2025 count and the state, metropolitan and model tables) and its releases of 18 March 2025 and 9 April 2024 (the 2024, 2023 and 2022 counts), NICB’s half-year release of 30 September 2026, and the FBI’s Summary of Reported Crimes in the Nation, 2025, released August 2026 (the rate and the percentage change). Complaints: the Consumer Federation of America’s Consumer Agency Survey Report 2025, published 18 June 2026, and the state releases linked in the complaints table, each read at its address. Recalls: NHTSA’s 2025 Annual Report on safety recalls, published March 2026.
Odometer prosecutions: the Justice Department’s press release database, searched for releases with odometer in the title and counted by calendar year after removing announcements published twice by two offices on the same day. The four 2025 cases are linked to their releases. The 2002 estimate: NHTSA’s odometer fraud page and the report it links. Flood claims: NICB’s releases of 19 October 2017 and 24 October 2022.
Two things the counts are not. NICB’s theft figures are reports to law enforcement compiled by the bureau, and the FBI’s percentage is an estimate from agencies covering 96.2% of the population, so the two do not match to the decimal. The complaint rankings count complaints filed with one office in each state, and the states define their categories differently, so the table compares ranks within each state and not counts between states.
Previous editions: this is the first edition. Each edition keeps its figures unchanged after publication, and the next edition links back to this one.
Frequently asked questions
How many cars are stolen in the US each year?
In 2025, 659,880 vehicles were reported stolen in the United States, according to the National Insurance Crime Bureau, down from 850,708 in 2024 and a peak of 1,020,729 in 2023. The first half of 2026 brought 268,415 thefts, 21% fewer than the first half of 2025. The FBI says the 2025 theft rate was the lowest in 20 years.
Which state has the most car thefts?
California, with 136,988 vehicles reported stolen in 2025, followed by Texas (75,269), Illinois (28,327), Florida (27,142) and New York (24,206). Los Angeles was the metropolitan area with the most thefts, 53,911. The figures are NICB’s, from its release of 18 March 2026.
How many cars were recalled in 2025?
NHTSA counted 997 recalls in 2025 covering 31,268,058 vehicles and equipment items. Of those, 891 were vehicle recalls, covering 29,262,623 vehicles. The average completion rate of the recalls issued in 2024 was 73.4% when NHTSA measured, so the average recall still had about a quarter of its vehicles unrepaired.
How common is odometer fraud?
Nobody knows. The only government estimate, NHTSA’s study of April 2002, put it at about 452,000 cases a year, and nothing newer has been published. What can be counted is enforcement: federal prosecutors announced charges, pleas, convictions or sentences in odometer fraud cases seven times in 2025 and ten times in 2024, by our count of Justice Department releases.
Where do these used car statistics come from?
From the National Insurance Crime Bureau’s theft releases, the FBI’s yearly crime summary, NHTSA’s annual recalls report, the state attorneys general’s complaint rankings, the Consumer Federation of America’s agency survey and the Justice Department’s press release database. Each figure links to the release it comes from, with its date, and the methodology above says how our own count was made.
Discuss this article on r/VINvestigators. Got a listing that looks off, or a report that does not add up? Post it. Over 1,500 members, buyers and trade among them.
New guides and fraud alerts by email, a few times a month, no more. Subscribe on the home page.
Checking a specific car? Get the full vehicle history report from carVertical, an NMVTIS-approved provider, 20% off through our link. The link applies the discount automatically; if you go to carVertical later, the code VINVEST gives the same 20%. We earn a commission from carVertical if you buy; it costs you nothing extra.